Monit Monitoring Simplified. You’re going through this tutorial in less than 20 minutes which will explain how to get your server instance monitored using Monit. Start your countdown watch.
This tutorial below assumes you’re running these:
- PHP 7.0
- nginx/1.10.0
- mysql Ver 14.14 Distrib 5.7.13
- Ubuntu Server LTS 16.04
Under these assumptions:
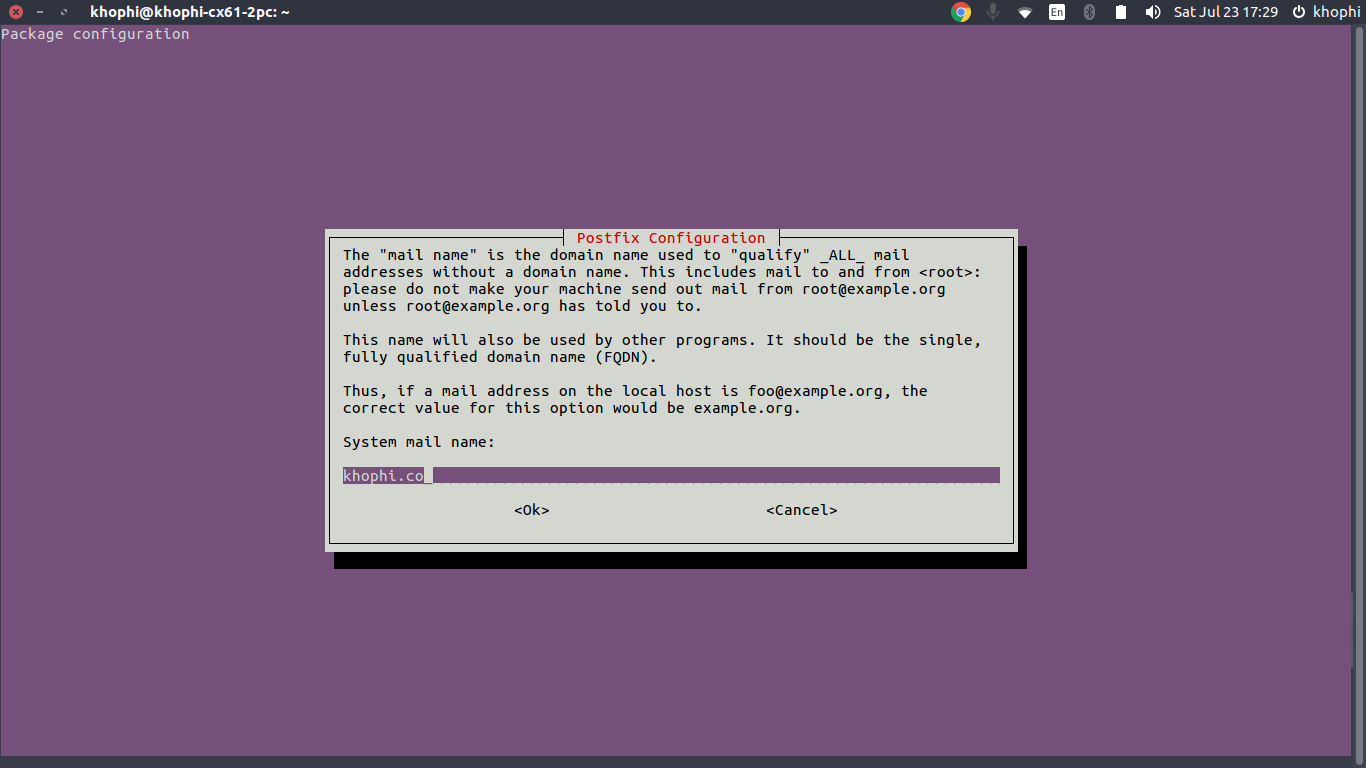
- Your hostname is
khophi.co - Your domain name is
maindomain.ext - Subdomain for monitoring monit via web interface is
yoursubdomain.maindomain.ext
In the beginning:
sudo apt install postfix mailutils
You will come across this:
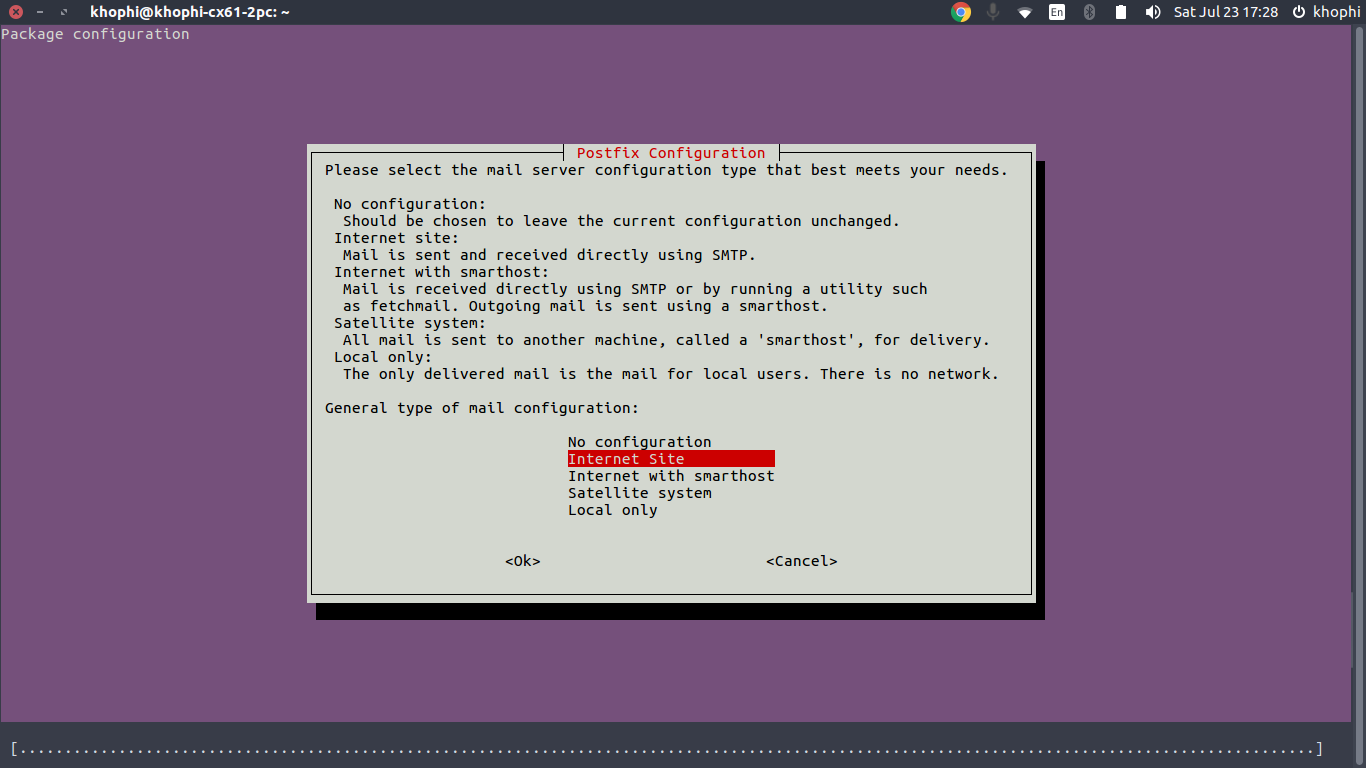
Select Internet Site then
Done with the UI settings for now. 2 minutes 30 seconds left
monitrc configurations
Step One
When you open the file below to edit, add this:
# enter this
$ sudo nano /etc/aliases
# /etc/aliases
postmaster:    root
root: youremailaddress@gmail.com
monit: root
Update the newly added aliases as:
$ sudo newaliases
At this point, a simple message to the root@localhost will is forwarded to youremailaddress@gmail.com too.
Try this:
$ echo "Test Message" | mail -s "I am subject" root
Monit Monitoring Configuring
Go:
$ sudo apt-get install monit
Then when you open the
$ sudo nano /etc/monit/monitrc
Uncomment these on lines 76, 108 to 119 and 162 respectively ( line positions will likely be these, they were for me )
set mailserver localhost

set mail-format {
      from: monit@$HOST
   subject: monit alert --  $EVENT $SERVICE
   message: $EVENT Service $SERVICE
                 Date:        $DATE
                 Action:      $ACTION
                 Host:        $HOST
                 Description: $DESCRIPTION

            Your faithful employee,
            Monit
}

set alert root@localhost not on { instance, action }

check system example.com
    if loadavg (1min) > 4 then alert
    if loadavg (5min) > 2 then alert
    if memory usage > 75% then alert
    if swap usage > 25% then alert
    if cpu usage (user) > 70% then alert
    if cpu usage (system) > 30% then alert
    if cpu usage (wait) > 20% then alert
Then add this part at the bottom of your file, just to check when storage is running full and notify you.
check filesystem rootfs with path /
    if space usage > 90% then alert
Save the file with Ctrl + X.
[wp_ad_camp_1]
Welcome back from the short commercial break. Now, open again
$ sudo nano /etc/monit/monitrc
then comment out the line on 293
# include /etc/monit/conf-enabled/*
Save the file and exit
Monitoring Our Server installation
Create a new file called lemp-instance using
$ sudo nano /etc/monit/conf.d/lemp-instance
Then add:
check process nginx with pidfile /var/run/nginx.pid
    group www-data
    start program = "/usr/sbin/nginx -g 'daemon on; master_process on;'"
    stop program = "/sbin/start-stop-daemon --quiet --stop --retry QUIT/5 --pidfile /run/nginx.pid"
#    if failed host khophi.co port 80 protocol http then restart
#    if 5 restarts within 5 cycles then timeout

check process mysql with pidfile /var/run/mysqld/mysqld.pid
    start program = "/etc/init.d/mysql start"
    stop program = "/etc/init.d/mysql stop"
    if failed unixsocket /var/run/mysqld/mysqld.sock then restart
    if 5 restarts within 5 cycles then timeout

check process php7.0-fpm with pidfile /var/run/php/php7.0-fpm.pid
    start program = "/etc/init.d/php7.0-fpm start"
    stop program = "/etc/init.d/php7.0-fpm stop"
    if failed host khophi.co port 80 protocol http then restart
    if 5 restarts within 5 cycles then timeout

check file nginx-error with path /var/log/nginx/error.log
    if match "^timed out" then alert
NOTE: Be sure where your
.pidfiles are located on your instances, especially with php7. I recommend you verify the .pidreferenced in there are actually there.
Save the file, then do
$ sudo monit -t
If all is okay, then proceed. You should get a message saying: Control file syntax OK if not, track the error and fix. For me, commenting out the `/etc/monit/conf-enabled/` solved an inclusion error I had.
Then
$ sudo service monit reload
Check the health of the monit instance:
$ sudo systemctl status monit.service
If you see greens, and no error messages, you’re on track – your monit is monitoring nicely
Allow the viewing of monitoring via terminal and web. Uncomment these in the file
$ sudo nano /etc/monit/monitrc
uncomment these on lines 149 to 152
set httpd port 2812 and
     use address localhost
     allow localhos
     allow crazyUsername:'aV3riS7hronge.paasweirdD'
Save file. Then…
See monitoring status after restarting monit service
$ sudo service monit restart
$ sudo monit status
See status in Web
You want to see the status from monit when you visit a URL, put this…
server {
    listen   80;
    server_name yoursubdomain.yourmaindomain.ext;

    location / {
            proxy_pass http://127.0.0.1:2812/;
            proxy_set_header Host $host;
            proxy_ignore_client_abort on;
    }
}
… in your file
$ sudo nano /etc/nginx/sites-available/monit
Save, then attached to enabled sites in Nginx as:
$ sudo ln -s /etc/nginx/sites-available/monit /etc/nginx/sites-enabled/
Check Nginx conf for errors:
$ sudo nginx -t
If all is fine, then proceed.
Domain Name Configuration
Visit your DNS configuration area. I use Digital Ocean and follow the pattern on screen
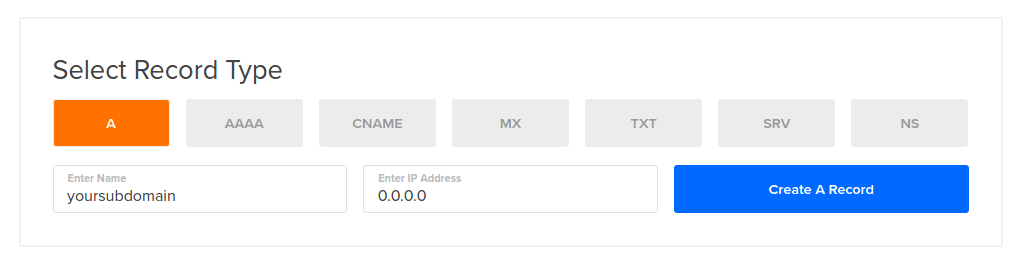
Then a CNAME
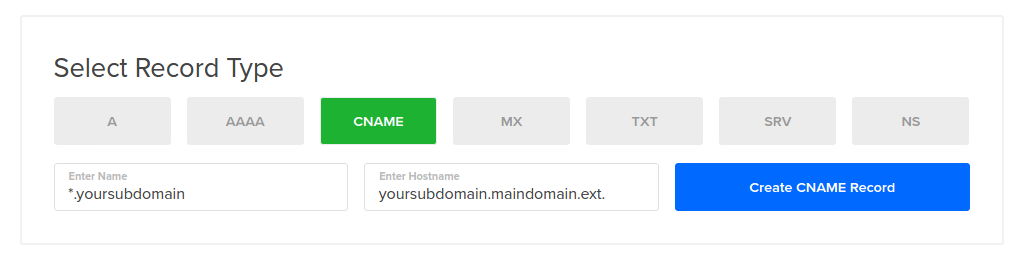
Wait for a couple of minutes for everything to settle with DNS routing.
Try visiting yoursubdomain.maindomain.ext and you should be faced with a login form. After login, you’ll be blessed with this:
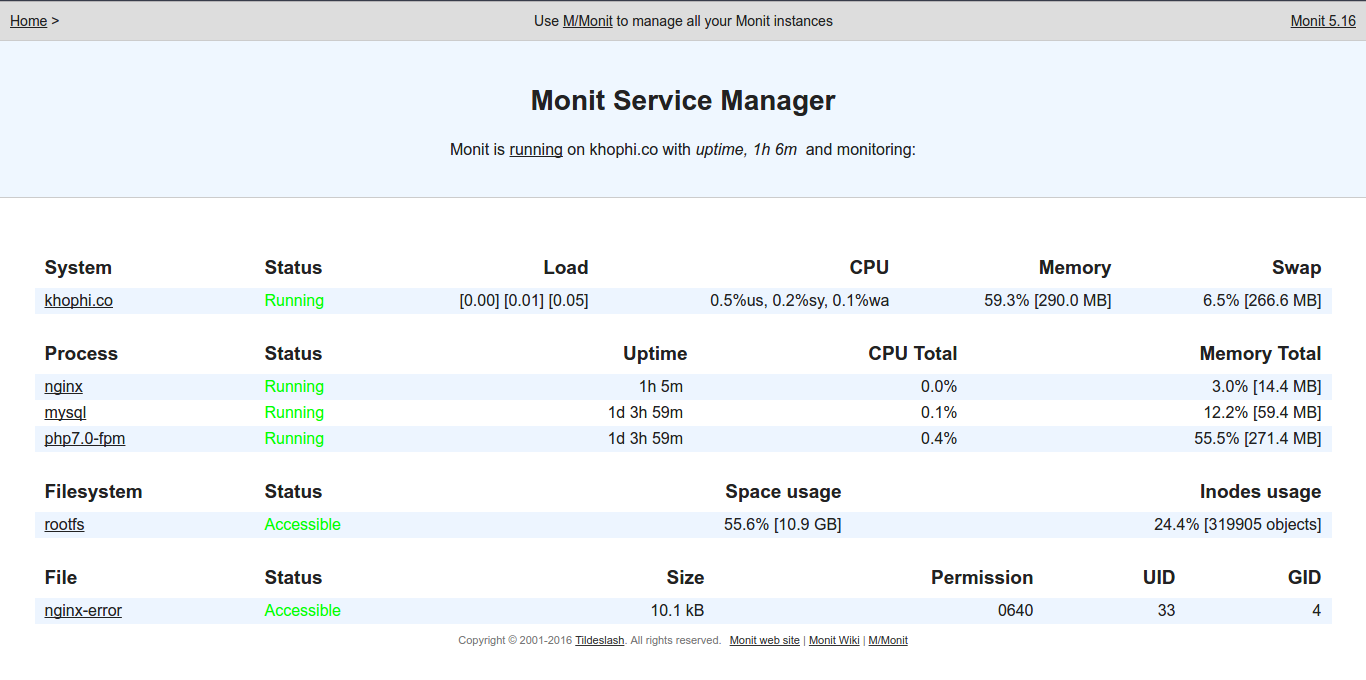
[wp_ad_camp_1]